Bus Stop Urban Design 
Introduction |
Literature Review |
7 Goals |
9 Techniques |
Selection |
9 Designs |
Bibliography
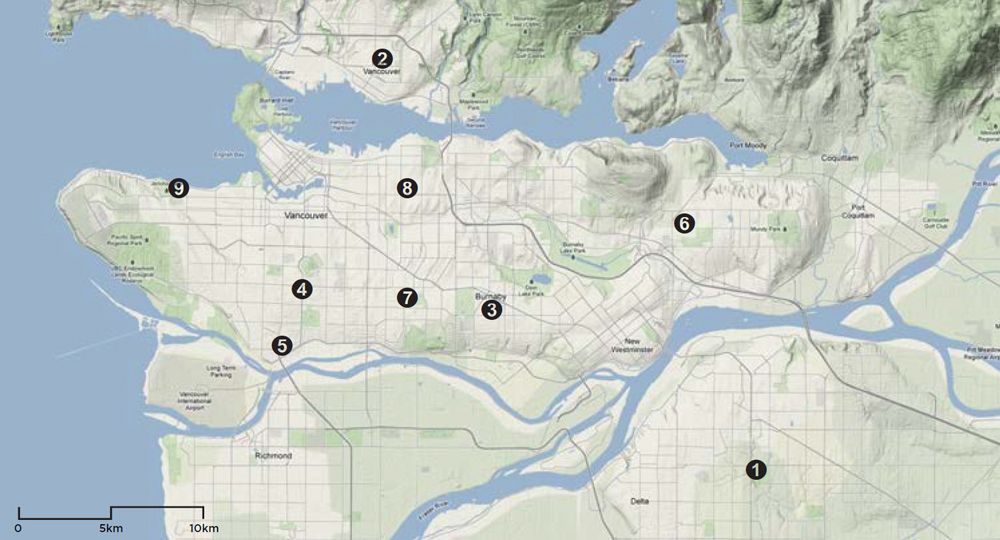
Figure 5.2.9: Map of Selected TransLink Bus Stops in Metro Vancouver
5.0 Design Applications
5.1 Design Process
In addition to developing and applying techniques to bus stops, this project also demonstrates a process that can be applied to many other urban design tasks. This process shows that with appropriate urban design expertise, site analysis, design, and visualization can be accomplished with minimal costs and widely available technology. All the tools used this process are either already available to municipalities or are free to acquire.The process is as follows:
- Map bus stops, density, municipal zoning, parks and streetlight data with ArcMap
- Select sites that cover a wide range of bus stop types and locations
- Construct existing plans with satellite photos and site photos
- Analyze the pedestrian flows, shadows and visibility* of each stop
- Gather ideas from fellow bus riders and literature review
- Model and render bus stop designs with SketchUp
- Review and revise designs with municipal planners and urban designers
- Combine final designs with relevant information for publication
5.2 Regional Bus Stop Analysis
For the purposes of this urban design project, bus stops in Metro Vancouver are placed into 5 urban form categories based on their adjacent zoning. Each category has its own needs and opportunities. The following are descriptions of the categories.Cat. 1: Stops In Highly Developed Areas
Few of these locations exist, mostly in city centre areas. Due to the abundance of activities nearby, the design of the stop can benefit both transit riders and nearby merchants and pedestrians. Because these stops are usually adjacent to major development sites, it is possible to work with the developers to come up with a bus stop that is integrated right from the design stage, giving the best possible result.Cat. 2: Stops By Businesses Or Community Amenities
Such locations are scattered throughout the region, each a node within their respective neighbourhoods. Opportunities exist for these stops to contribute to neighbourhood identity. Consultation with neighbouring businesses is key to providing complementary amenities that enhance the overall space.Cat. 3: Stops In Medium Density Residential Neighbourhoods
These stops are numerous in the region. Ridership is often high at these stops. Therefore it is important to cater to the needs of the riders. Due to the high vehicular and pedestrian traffic in such areas and their relative importance as nodes of activity, the design can either be ad-supported or funded by the city.Cat. 4: Stops In Single Family Residential Neighbourhoods
These stops are extremely common, so it is important to have an easily replicable design. Because wait times are often long, rider comfort and safety are crucial. Here, the emphasis is on providing the basic needs such as seating, cover, lighting, and access.Cat. 5: Stops Adjacent To Parks Or Open Spaces
These stops are also fairly numerous in the region. Because the stops are often on city owned land, the designs of these stops can be less conventional, take up more space, and serve as amenities or markers in the park. Due to the low traffic in such areas, it is unlikely for ad-supported stops to be feasible. However, if the stops are well designed and benefit the park goers, it is possible for funding to come from parks and other related departments.5.2.1 Bus Stop Mapping
As Category 1 stops are very rare and subject to many factors, they are not mapped. Category 2, 3, 4, and 5 bus stops are mapped using ArcMap and GIS data provided by municipalities.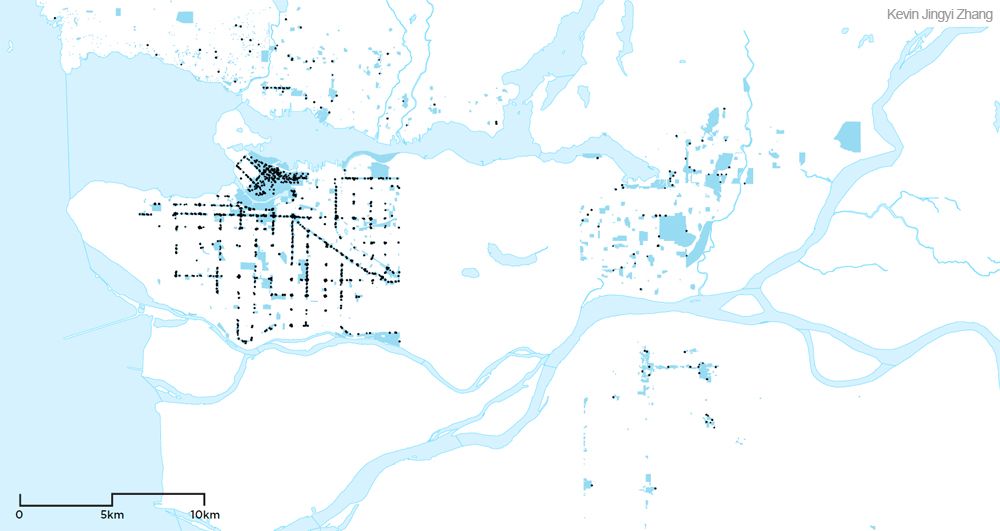
Figure 5.2.1: Cat. 2: Bus Stops By Businesses Or Community Amenities Note: Data for Richmond and Burnaby unavailable at time of study.
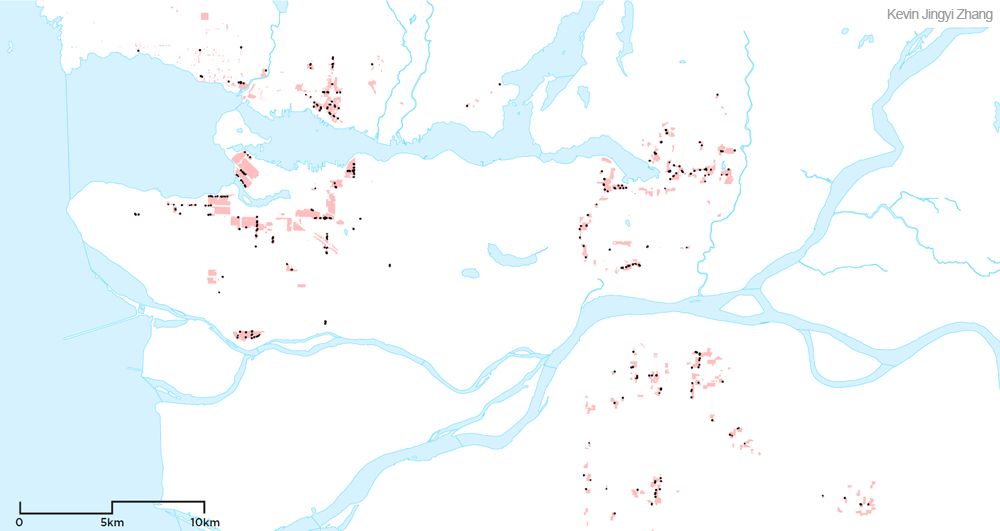
Figure 5.2.2: Cat. 3: Bus Stops In Medium Density Residential Neighbourhoods Note: Data for Richmond and Burnaby unavailable at time of study.
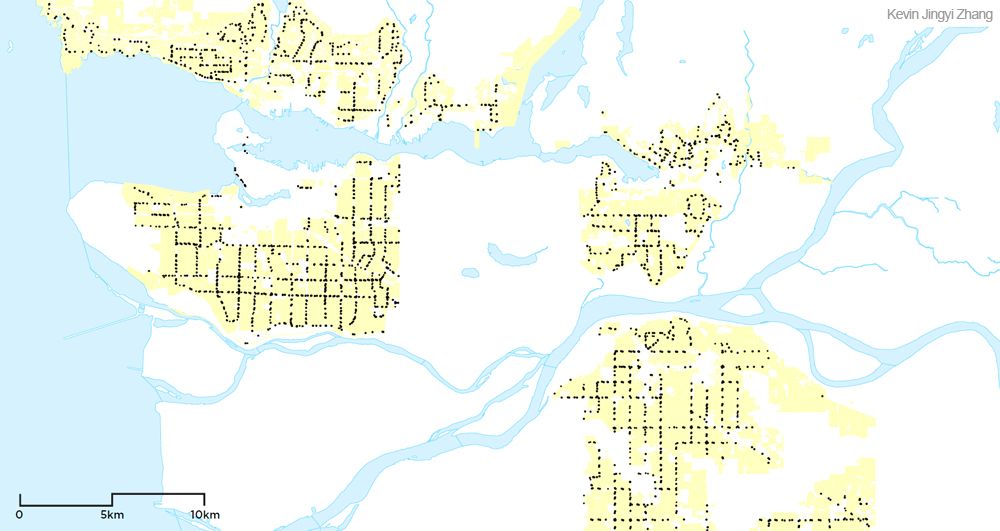
Figure 5.2.3: Cat. 4: Bus Stops In Single Family Residential Neighbourhoods Note: Data for Richmond and Burnaby unavailable at time of study.
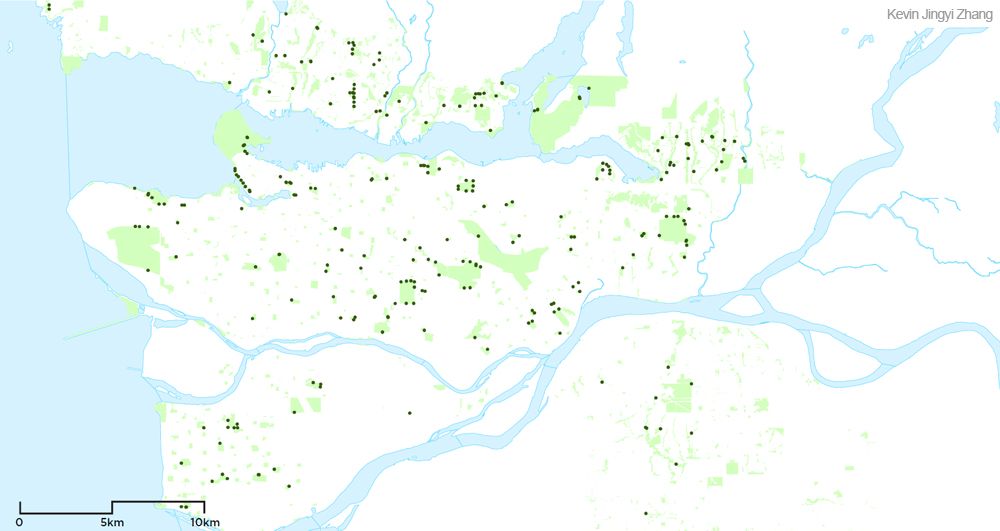
Figure 5.2.4: Cat. 5: Bus Stops Adjacent To Parks Or Open Spaces
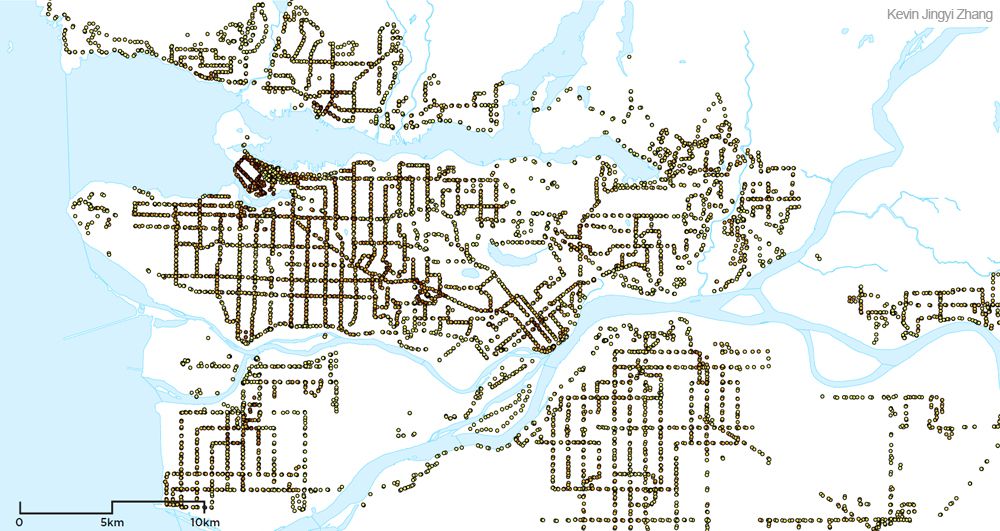
Figure 5.2.5: Bus Stops and Residential Density in Metro Vancouver. Bus stops are coloured corresponding to the residential density of their respective neighbourhoods. Souce: 2006 Canadian Census
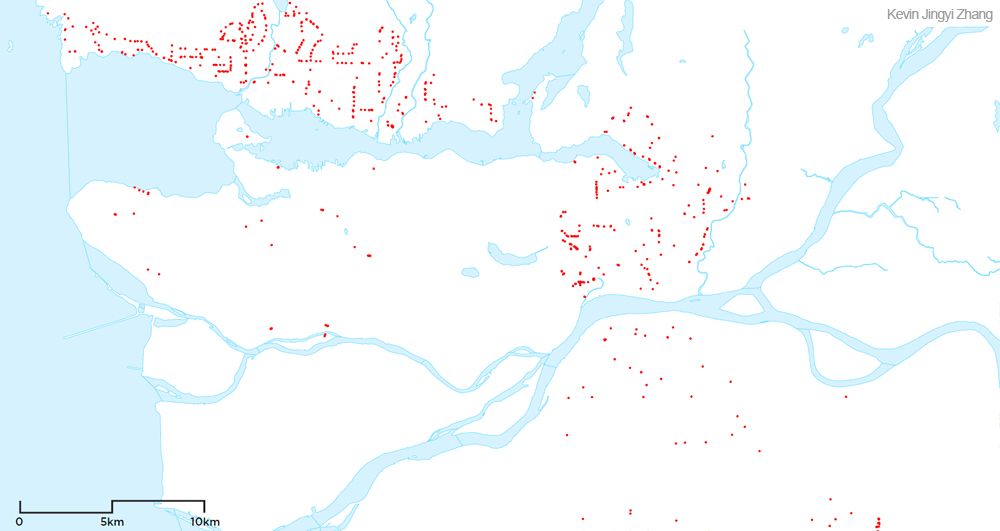
Figure 5.2.6: Bus Stops and Lighting. Bus stops that are more than 25m away from street lights are identified. Note: Data for Richmond and Burnaby unavailable at time of study.
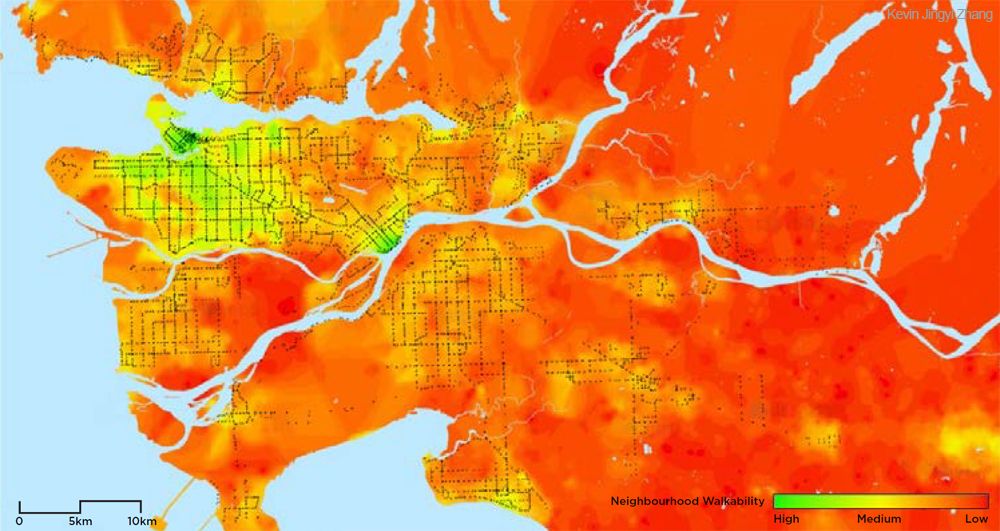
Figure 5.2.7: Walkability and Bus Stops in Metro Vancouver. Bus stops are overlaid over a walkability map of Metro Vancouver. Source: UBC Active Transportation Collaboratory
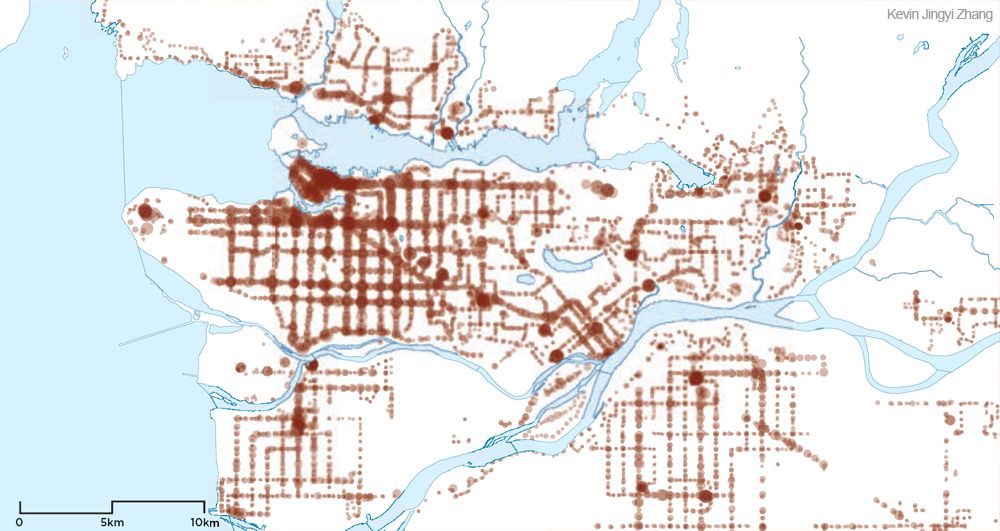
Figure 5.2.8: Transit Ridership in Metro Vancouver, Bus Stops Sized by Projected Daily Boardings Bus stops are mapped based on daily boardings, ranging from 10 to 11,000 Source: TransLink
5.2.2 Bus Stop Selection
Nine stops in Metro Vancouver are chosen to illustrate each of the BSUD techniques. In addition to showcasing the techniques, the stops need to exhibit a wide range of environmental factors. To accomplish this, I checked the candidate stops with the analysis depicted in Figures 5.2.1 to 5.2.8. This assured that the stops are adjacent to a wide range of developments, reside in many different density neighbourhoods, have multiple lighting conditions, and have different levels of walkability and bus ridership. This multitude of selection criteria ensures that the final 9 stops selected represent the overall network well. Other minor factors also affected the selection process, such as the desire to cover multiple municipalities in Metro Vancouver and limitations caused by lack of data in some locations.
Figure 5.2.9: Map of Selected TransLink Bus Stops in Metro Vancouver
BSUD Project Map
2.1 Urban Realm and Transit Ridership
2.2 Urban Realm and Active Transportation
2.3 Physical Activity and Health